

Use depsets
Whenever you are rolling up information from rule dependencies you should use depsets. Only use plain lists or dicts to publish information local to the current rule. A depset represents information as a nested graph which enables sharing. Consider the following graph:'a' is mentioned four times! With larger graphs this
problem will only get worse.
Here is an example of a rule implementation that uses depsets correctly to
publish transitive information. Note that it is OK to publish rule-local
information using lists if you want since this is not O(N^2).
Avoid calling depset.to_list()
You can coerce a depset to a flat list using
to_list(), but doing so usually results in O(N^2)
cost. If at all possible, avoid any flattening of depsets except for debugging
purposes.
A common misconception is that you can freely flatten depsets if you only do it
at top-level targets, such as an <xx>_binary rule, since then the cost is not
accumulated over each level of the build graph. But this is still O(N^2) when
you build a set of targets with overlapping dependencies. This happens when
building your tests //foo/tests/..., or when importing an IDE project.
Reduce the number of calls to depset
Calling depset inside a loop is often a mistake. It can lead to depsets with
very deep nesting, which perform poorly. For example:
Use ctx.actions.args() for command lines
When building command lines you should use ctx.actions.args(). This defers expansion of any depsets to the execution phase. Apart from being strictly faster, this will reduce the memory consumption of your rules — sometimes by 90% or more. Here are some tricks:-
Pass depsets and lists directly as arguments, instead of flattening them
yourself. They will get expanded by
ctx.actions.args()for you. If you need any transformations on the depset contents, look at ctx.actions.args#add to see if anything fits the bill. -
Are you passing
File#pathas arguments? No need. Any File is automatically turned into its path, deferred to expansion time. - Avoid constructing strings by concatenating them together. The best string argument is a constant as its memory will be shared between all instances of your rule.
-
If the args are too long for the command line an
ctx.actions.args()object can be conditionally or unconditionally written to a param file usingctx.actions.args#use_param_file. This is done behind the scenes when the action is executed. If you need to explicitly control the params file you can write it manually usingctx.actions.write.
Transitive action inputs should be depsets
When building an action using ctx.actions.run, do not forget that theinputs field accepts a depset. Use this whenever inputs are
collected from dependencies transitively.
Hanging
If Bazel appears to be hung, you can hit Ctrl-\ or send Bazel aSIGQUIT signal (kill -3 $(bazel info server_pid)) to get a thread
dump in the file $(bazel info output_base)/server/jvm.out.
Since you may not be able to run bazel info if bazel is hung, the
output_base directory is usually the parent of the bazel-<workspace>
symlink in your workspace directory.
Performance profiling
Bazel writes a JSON profile tocommand.profile.gz in the output base by
default. You can configure the location with the
--profile flag, for example
--profile=/tmp/profile.gz. Location ending with .gz are compressed with
GZIP.
To see the results, open chrome://tracing in a Chrome browser tab, click
“Load” and pick the (potentially compressed) profile file. For more detailed
results, click the boxes in the lower left corner.
You can use these keyboard controls to navigate:
- Press
1for “select” mode. In this mode, you can select particular boxes to inspect the event details (see lower left corner). Select multiple events to get a summary and aggregated statistics. - Press
2for “pan” mode. Then drag the mouse to move the view. You can also usea/dto move left/right. - Press
3for “zoom” mode. Then drag the mouse to zoom. You can also usew/sto zoom in/out. - Press
4for “timing” mode where you can measure the distance between two events. - Press
?to learn about all controls.
Profile information
Example profile: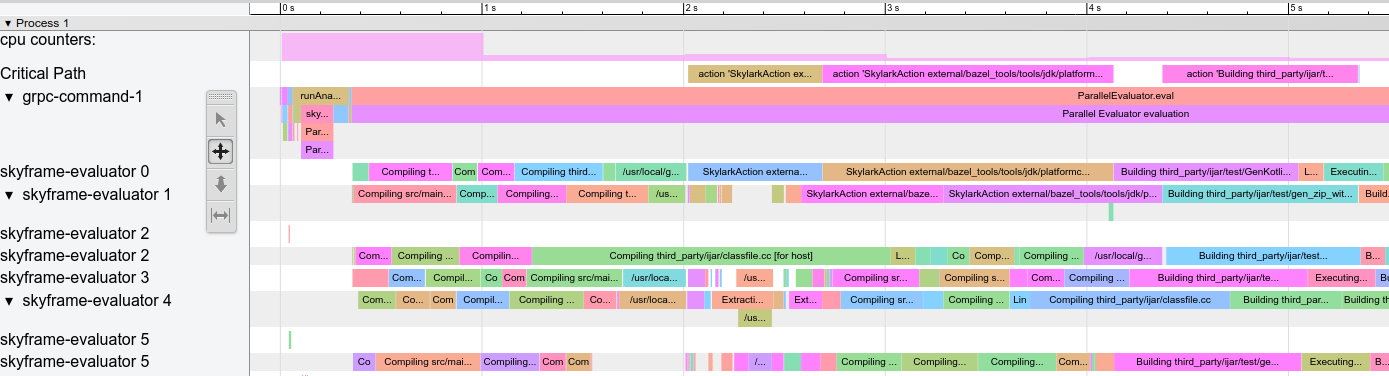
action counters: Displays how many concurrent actions are in flight. Click on it to see the actual value. Should go up to the value of--jobsin clean builds.cpu counters: For each second of the build, displays the amount of CPU that is used by Bazel (a value of 1 equals one core being 100% busy).Critical Path: Displays one block for each action on the critical path.grpc-command-1: Bazel’s main thread. Useful to get a high-level picture of what Bazel is doing, for example “Launch Bazel”, “evaluateTargetPatterns”, and “runAnalysisPhase”.Service Thread: Displays minor and major Garbage Collection (GC) pauses.
Common performance issues
When analyzing performance profiles, look for:- Slower than expected analysis phase (
runAnalysisPhase), especially on incremental builds. This can be a sign of a poor rule implementation, for example one that flattens depsets. Package loading can be slow by an excessive amount of targets, complex macros or recursive globs. - Individual slow actions, especially those on the critical path. It might be
possible to split large actions into multiple smaller actions or reduce the
set of (transitive) dependencies to speed them up. Also check for an unusual
high non-
PROCESS_TIME(such asREMOTE_SETUPorFETCH). - Bottlenecks, that is a small number of threads is busy while all others are idling / waiting for the result (see around 15s-30s in above screenshot). Optimizing this will most likely require touching the rule implementations or Bazel itself to introduce more parallelism. This can also happen when there is an unusual amount of GC.
Profile file format
The top-level object contains metadata (otherData) and the actual tracing data
(traceEvents). The metadata contains extra info, for example the invocation ID
and date of the Bazel invocation.
Example:
ts) and durations (dur) in the trace events are given in
microseconds. The category (cat) is one of enum values of ProfilerTask.
Note that some events are merged together if they are very short and close to
each other; pass --noslim_json_profile if you would like to
prevent event merging.
See also the
Chrome Trace Event Format Specification.
analyze-profile
This profiling method consists of two steps, first you have to execute your build/test with the--profile flag, for example
/tmp/prof) is a binary file, which can be
postprocessed and analyzed by the analyze-profile command:
Memory profiling
Bazel comes with a built-in memory profiler that can help you check your rule’s memory use. If there is a problem you can dump the heap to find the exact line of code that is causing the problem.Enabling memory tracking
You must pass these two startup flags to every Bazel invocation:$(BAZEL) for your repository location.
These start the server in memory tracking mode. If you forget these for even
one Bazel invocation the server will restart and you will have to start over.
Using the Memory Tracker
As an example, look at the targetfoo and see what it does. To only
run the analysis and not run the build execution phase, add the
--nobuild flag.
bazel dump --rules:
pprof file
using bazel dump --skylark_memory:
pprof tool to investigate the heap. A good starting point is
getting a flame graph by using pprof -flame $HOME/prof.gz.
Get pprof from https://github.com/google/pprof.
Get a text dump of the hottest call sites annotated with lines: